A year ago, my team and I were faced with a classic migration: replacing a swath of legacy components with updated design system components in a large monorepo. As with any other migration, its long-term viability rested on our ability to answer questions like:
- How much progress have we made?
- Which teams or product areas are still using deprecated components?
- Which deprecated components are used most often?
Observability platforms are famously adept at answering questions about your software in real time by querying, aggregating, and visualizing complex data. So while we typically associate them with runtime telemetry, I’ve found them to be equally powerful at storing static code analysis to keep track of large-scale migrations.
To illustrate, I’ll walk through how I set up automated static code analysis scans and sent the data to an observability provider (Honeycomb) to track our design system migration.
At a high level, the process is this:
- Scan the codebase for component usage
- Shape the results into queryable events/spans
- Export via OpenTelemetry (OTLP) to your backend
- Query + visualize adoption over time
Step 1: Scan the codebase for component usage
I used react-scanner to crawl our codebase and extract React component usage. The tool ships with built-in processors, but I wrote a custom processor to gather important information like the component instance CODEOWNER and whether or not the component was deprecated:
const config = {
  crawlFrom: "./src",
  includeSubComponents: true,
  importedFrom: /@design-system\/.+/,
  exclude: ["node_modules", "dist", "build"],
  processors: [
    ["count-components-and-props", { outputTo: "components-usage.json" }],
    ["raw-report", { outputTo: "raw-report.json" }],
    componentUsageByCodeownerProcessor, // My custom processor, grabbing CODEOWNERs and deprecated component info
  ],
};
Step 2: Emit Results as Spans
Once I had the component usage data, I needed to structure it for querying. The custom processor iterates through every component instance and sends it to Honeycomb as a span with properties like file path, component name, and which team owns the code:
import Codeowners from "codeowners";

const repo = new Codeowners("../path/to/CODEOWNERS");

export const componentUsageByCodeownerProcessor = async ({ prevResult }) => {
  const sdk = initOTelSDK("static-analysis");
  sdk.start();

  const tracer = trace.getTracer("code-scanner");
  const rootSpan = tracer.startSpan("scan codebase");
  const rootContext = trace.setSpan(ROOT_CONTEXT, rootSpan);

  for (const [componentName, { instances }] of Object.entries(prevResult)) {
    for (const instance of instances) {
      const { location: { file }, importInfo: { moduleName }, props } = instance;

      // Enrich with codeowner data
      const owner = await repo.getOwner(file);

      // Emit as a span
      context.with(rootContext, () => {
        const span = tracer.startSpan("component instance");
        span.setAttribute("component.name", componentName);
        span.setAttribute("component.module", moduleName);
        span.setAttribute("component.filepath", file);
        span.setAttribute("component.codeowner", owner);
        span.setAttribute("component.props", JSON.stringify(props));
        span.setAttribute("component.isDeprecated", isDeprecated(componentName, moduleName));
        span.end();
      });
    }
  }

  rootSpan.end();
  await sdk.shutdown();
};
See a more complete example in this gist.
The attributes here are key to being able to query for all kinds of things: Which deprecated component is used most? Which props are unused? Which teams have made the most migration progress this quarter?
There is one important limitation here: Each scan is represented as a single trace (root span = the scan), with one child span per component instance. Because of this you’ll want to scope “instance count” queries to a single scan (or to the latest scan) to avoid double-counting. You can also consider adding a scan.id attribute to every span and ensure your queries filter for it.
Step 3: Configure OpenTelemetry
With the data shaped as spans, I needed to configure the plumbing to send it to an observability provider (in our case, Honeycomb). The OTel setup was straightforward — just point an OTLP exporter at Honeycomb:
// tracing.js

const sdk = new NodeSDK({
  spanProcessors: [
    new BatchSpanProcessor(
      new OTLPTraceExporter({
        url: `${HONEYCOMB_ENDPOINT}/v1/traces`,
        headers: { "x-honeycomb-team": apiKey },
      }),
      { maxQueueSize: 10000 } // Increase for large codebases
    ),
  ],
  serviceName: "static-analysis",
});
Another notable gotcha here: Static analysis of a large codebase generates thousands of spans. I had to increase maxQueueSize to avoid dropping data. To avoid the costs associated with this, you might choose to sample, restrict attributes, or limit your component scan to only certain components.
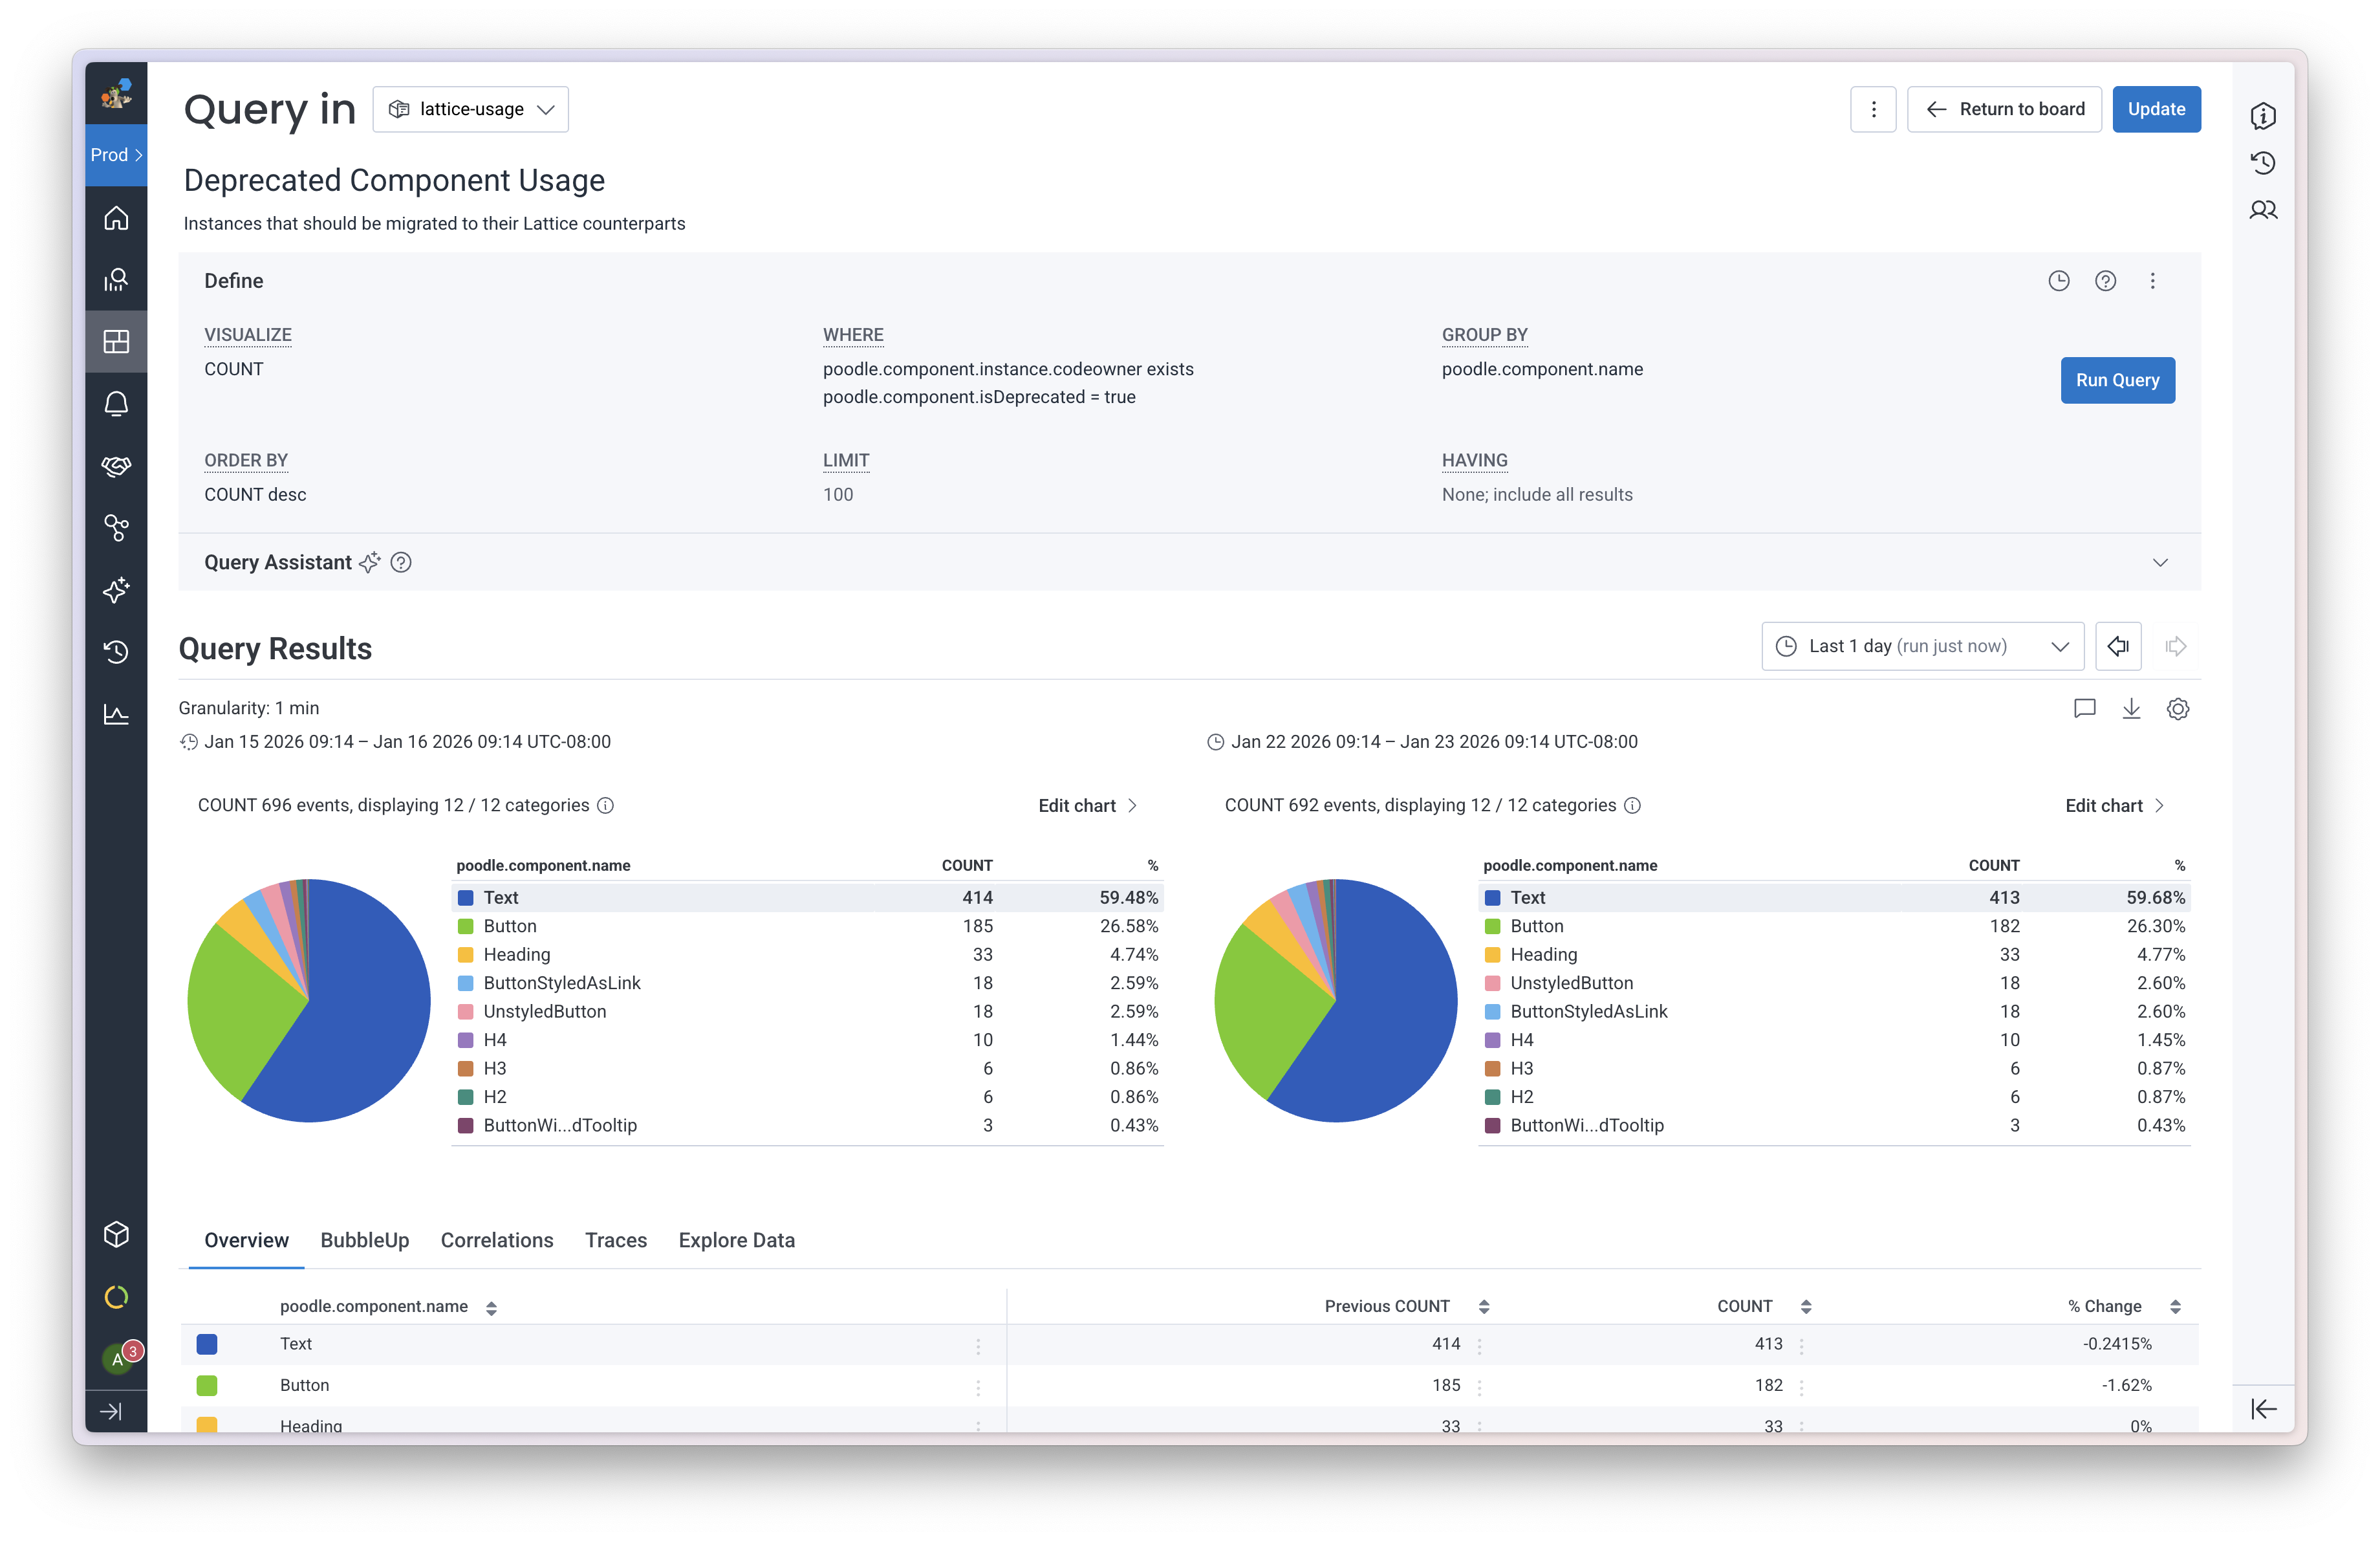
Step 4: Query and Visualize
Now for the payoff: turning this data into actionable insights. Once the data landed in Honeycomb, I set up queries to track deprecated component usage along with design system component usage:
Next, I assembled saved queries into a board where I could view everything at a glance:
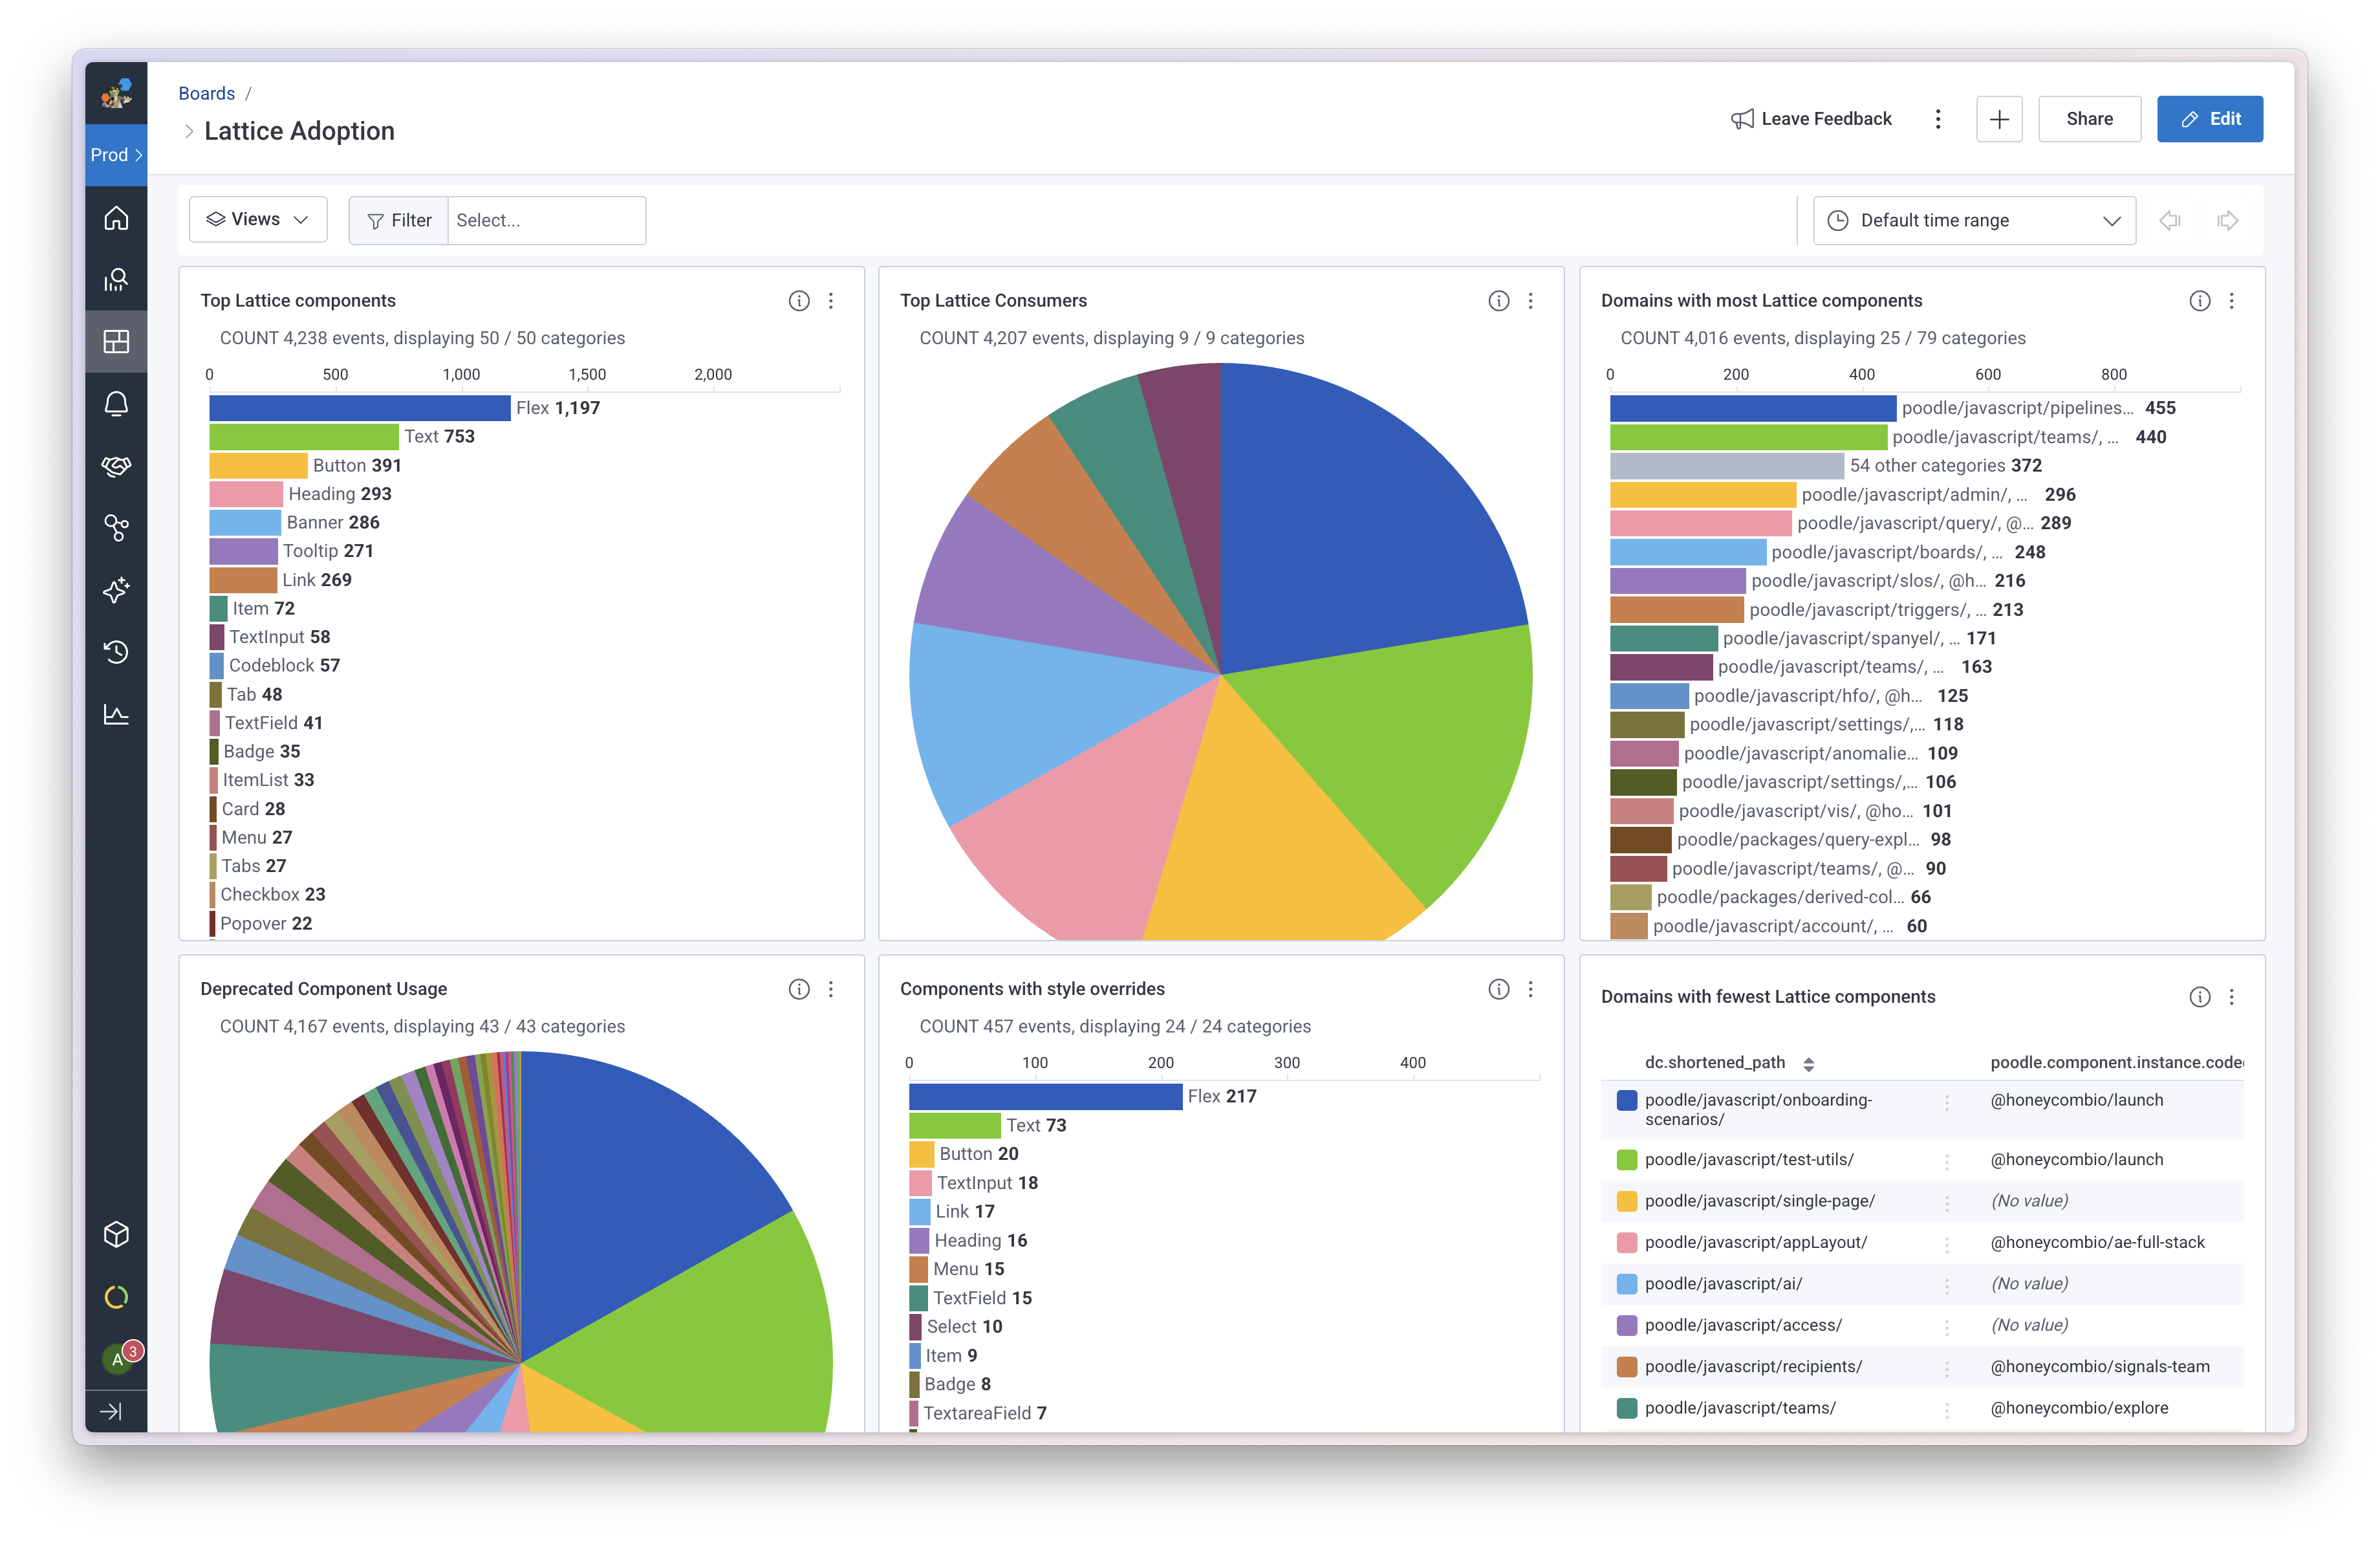
We’ve been running this scan daily in CI for the last year. The data and dashboard have become a regular part of our team’s roadmap planning, leveraging it to identify which product areas need migration support or which components have key feature gaps preventing teams from making progress. It’s also become a one-stop shop for teams to check in on their progress without us stepping in.
Note for design system folks: I spoke in-depth about what design system usage data we tracked and how we used the information in this episode of The Question. Check out the video recap or collaborative Figjam for more details.
Other Migrations You Can Track
While the example here focused on design system adoption, the same pattern can apply to other large-scale migrations you may want to monitor:
- Library upgrades: Track usage of deprecated APIs as you migrate to a new version
- Framework migrations: Monitor adoption of new patterns (e.g., moving from class components to hooks)
- Dependency consolidation: Track which teams are still using the library you’re trying to remove
- Dependency drift: Track how out of date your dependencies are
Wrapping Up
Migrations risk failing when you can’t see progress. Static code analysis can tell you exactly where you stand, but that data is more valuable when you can track it over time. By sending it to an observability platform it becomes queryable, visualizable, and alertable. For platform teams driving large-scale migrations, it’s a powerful pattern.